Who reads the board
- Me. Whatever number I need, I can add.
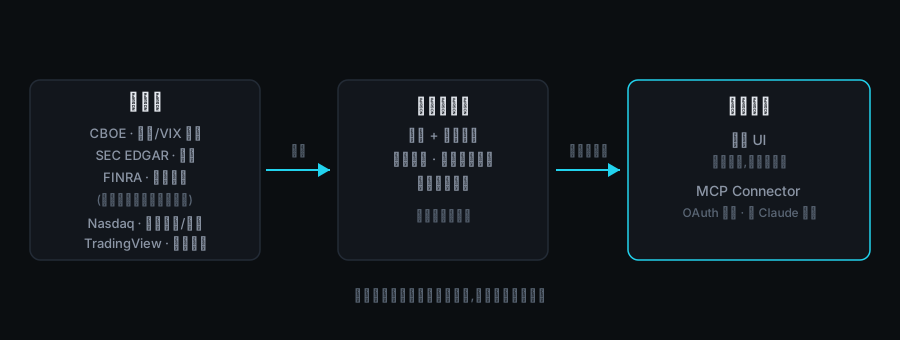
- Claude, or any model that can connect over MCP. Ask for an analysis and it tells you: “The Nasdaq fell 1.2%; seventy percent of that came from five heavyweights, but advancers and decliners were nearly even.”
What the board shows
- Index level and trading session. Pre-market adds an implied index line: an estimate of where the Nasdaq might open, derived from constituents’ pre-market prices.
- Index attribution. Answers “who moved the Nasdaq 100 today”: splits the index move across constituents, lists the biggest contributors up and down, and gives the advance/decline count and the median move.
- Sector rotation. Eleven sector ETFs ranked against the S&P over 1 day, 1 week, 1 month and 3 months — where money has been flowing from and to.
- Watchlist and calendar. The top ten Nasdaq weights by price, 52-week position, valuation percentile, earnings revisions and short interest; the calendar covers constituent earnings and macro releases for the next two weeks.
- Conditional history. For example: “After a single-day VIX jump of 10% or more, what did the Nasdaq do over the next twenty sessions?”
What the data is
During the session you see current quotes; when markets are closed, the last session’s closing snapshot. Quotes come from CBOE delayed data, with an inherent lag of about fifteen minutes. Source and basis are stated in the footer.